colorstamps.stamps module
Colormap by name
colorstamps.stamps.get_cmap() is a getter function that selects the correct function based on the name of the colormap. It is called when a colormap is requested by name in colorstamps.helpers.apply_stamp().
- colorstamps.stamps.get_cmap(name, l=None, rot=None, J=None, sat=None, limit_sat=None, a=None, b=None)
getter function for named colormaps the ‘alt’ colormaps are rotated 45 degrees flat colormaps are: —————- ‘flat’, ‘disk’ colormaps with a bright center: —- ‘peak’, ‘cone’ colormaps with a dark center: —— ‘abyss’, ‘funnel’ alternate with a bright center: —- ‘hsv’, ‘fourCorners’, ‘fourEdges’, ‘teuling0w’ to ‘teuling3w’ colormaps with lighness on y axis: - ‘barrel’, ‘cut’, ‘blues’, ‘reds’, ‘greens’, ‘yellows’ teuling colormaps: ——— ‘teuling0f’, ‘teuling1f’, ‘teuling2f’, ‘teuling3f’, ‘teuling0w’, ‘teuling1w’, ‘teuling2w’, ‘teuling3w’
any matplotlib colormap can also be converted to a colormap with lighness on y-axis
- Parameters
name – string For radial colormaps the name may have a postfix separated by a space, i.e. ‘cone tr’ the postfix must be some combination of (t,b) and/or (l,r) which defines the quadrant/side of the colormap to include t-> top, b-> bottom, r-> right, l-> left, and ‘tr’-> top right, etc.
l – int, the size of the colormap will be (l,l), defaults to 256 if None
rot – float, rotation of the colormap (where applicable)
J – array-like of length 2 (float,float), determins min and max luminocity where applicable
sat – float, maximum saturation where applicable
limit_sat – string, ‘individual’ or ‘shared’. How saturation is limited for relevant colormaps when colors outside sRGB are required ‘individual’: each combination J, hue in the colormap has an individual limit to saturation ‘shared’: for each J, all hues share a limit, the maximum where all hues can be represented
a – range along a-axis, array-like [min,max] Used to move the center of the colormap where applicable. Defaults to (-1,1) which is then multiplied internally with sat
b – range along b-axis, see a.
- Returns
a (l,l,3) numpy array of rgb values
Functions for spesific colormaps
get_const_J
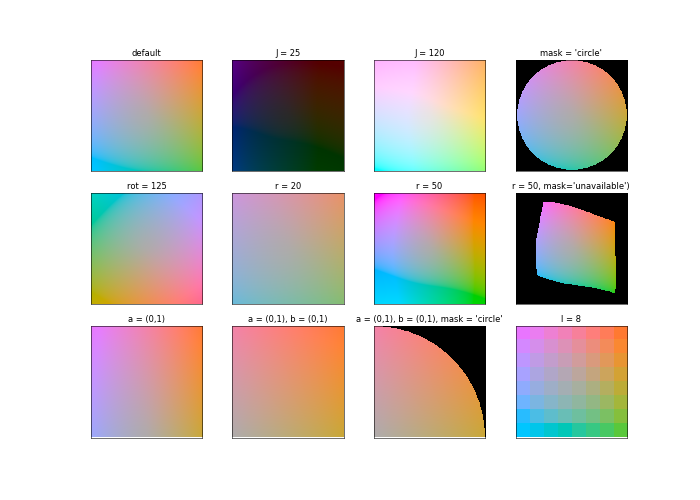
colorstamps.stamps.get_const_J() is used for the ‘flat’ and ‘disk’ colormaps
- colorstamps.stamps.get_const_J(J=95, a=(- 1, 1), b=(- 1, 1), r=33.0, l=256, mask='no_mask', rot=0)
Generates am rgb colormap of (l,l,3) that attempts to keep a constant lightness in the CAM02-LCD colorspace The colormap is based on the a-b plane of the Jab colorspace for a constant J.
- Parameters
J – float (lighness), default 95, range approximately 1->128,
a – tuple of 2 floats, default (-1,1). The limit along the a-axis will be (a[0]*r,a[1]*r)
b – tuple of 2 floats, default (-1,1). The limit along the b-axis will be (b[0]*r,b[1]*r)
r – float, default 33.0. The saturation where a or b is 1. (named ‘r’ for radius in the a-b plane)
l – int, default 256. Size of the colormap.
mask – string, default ‘no_mask’. If ‘circle’ makes a circular mask, and everything outside will be np.nan If ‘unavailable’ makes a colors that “should” have rgb<0 or rgb>1 when transformed to sRGB will be np.nan
rot – rotation of the hues on the a-b plane, in degrees
- Returns
a (l,l,3) numpy array of rgb values
import matplotlib.pyplot as plt
import colorstamps
fig, axes = plt.subplots(3,4,figsize=(14,10), dpi = 50)

cmap = colorstamps.stamps.get_const_J()
axes[0,0].imshow(cmap, origin = 'lower')
axes[0,0].set_title('default')

cmap = colorstamps.stamps.get_const_J(J=25)
axes[0,1].imshow(cmap, origin = 'lower')
axes[0,1].set_title('J = 25')

cmap = colorstamps.stamps.get_const_J(J=120, a=(- 1, 1), b=(- 1, 1), r=33.0, l=256, mask='no_mask', rot=0)
axes[0,2].imshow(cmap, origin = 'lower')
axes[0,2].set_title('J = 120')

cmap = colorstamps.stamps.get_const_J(mask = 'circle')
axes[0,3].imshow(cmap, origin = 'lower')
axes[0,3].set_title("mask = 'circle'")

cmap = colorstamps.stamps.get_const_J(rot=125)
axes[1,0].imshow(cmap, origin = 'lower')
axes[1,0].set_title('rot = 125')

cmap = colorstamps.stamps.get_const_J(r=20)
axes[1,1].imshow(cmap, origin = 'lower')
axes[1,1].set_title('r = 20')

cmap = colorstamps.stamps.get_const_J(r=50)
axes[1,2].imshow(cmap, origin = 'lower')
axes[1,2].set_title('r = 50')

cmap = colorstamps.stamps.get_const_J(r=50, mask='unavailable')
axes[1,3].imshow(cmap, origin = 'lower')
axes[1,3].set_title("r = 50, mask='unavailable')")


cmap = colorstamps.stamps.get_const_J( a = (-1,0))
axes[2,0].imshow(cmap, origin = 'lower')
axes[2,0].set_title('a = (-1,0)')

cmap = colorstamps.stamps.get_const_J( a = (-1,0), b = (0,1))
axes[2,1].imshow(cmap, origin = 'lower')
axes[2,1].set_title('a = (-1,0), b = (0,1)')


cmap = colorstamps.stamps.get_const_J(a = (-1,0), b = (0,1), mask = 'circle')
axes[2,2].imshow(cmap, origin = 'lower')
axes[2,2].set_title('a = (-1,0), b = (0,1), '+"mask = 'circle'")

cmap = colorstamps.stamps.get_const_J(l = 8)
axes[2,3].imshow(cmap, origin = 'lower')
axes[2,3].set_title('l = 8')

for ax in axes.ravel():
        ax.set_xticks([])
        ax.set_yticks([])
fig.patch.set_facecolor('white')
get_var_J
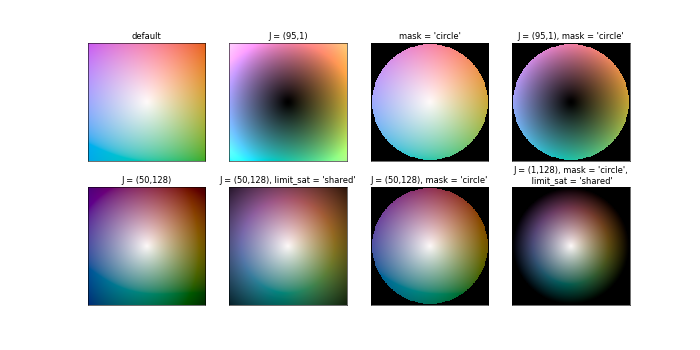
colorstamps.stamps.get_var_J() is used for the ‘peak’, ‘abyss’, ‘cone’, and ‘funnel’ colormaps
- colorstamps.stamps.get_var_J(J=[95, 128.5], a=(- 1, 1), b=(- 1, 1), r=33.0, l=256, mask='no_mask', rot=0, limit_sat=None)
Generates am rgb colormap of (l,l,3) that attempts to keep a constant lightness in the CAM02-LCD colorspace The colormap is based on the a-b plane of the Jab colorspace for a constant J.
- Parameters
J – (lighness) tuple of 2 floats, default [95,128.5] defining the range of lightness for the colormap, default 95, max range of J approximately 1 to 128.5
a – tuple of 2 floats, default (-1,1). The limit along the a-axis will be (a[0]*r,a[1]*r)
b – tuple of 2 floats, default (-1,1). The limit along the b-axis will be (b[0]*r,b[1]*r)
r – float, default 33.0. The saturation where a or b is 1. (named ‘r’ for radius in the a-b plane)
l – int, default 256. Size of the colormap.
mask – string, default ‘no_mask’. If ‘circle’ makes a circular mask, and everything outside will be np.nan If ‘unavailable’ makes a colors that “should” have rgb<0 or rgb>1 when transformed to sRGB will be np.nan
rot – rotation of the hues on the a-b plane, in degrees
- Returns
a (l,l,3) numpy array of rgb values
import matplotlib.pyplot as plt
import colorstamps
fig, axes = plt.subplots(2,4,figsize=(14,7), dpi = 50)

cmap = colorstamps.stamps.get_var_J()
axes[0,0].imshow(cmap, origin = 'lower')
axes[0,0].set_title('default')

cmap = colorstamps.stamps.get_var_J(J = (95,1))
axes[0,1].imshow(cmap, origin = 'lower')
axes[0,1].set_title('J = (95,1)')

cmap = colorstamps.stamps.get_var_J(mask = 'circle')
axes[0,2].imshow(cmap, origin = 'lower')
axes[0,2].set_title("mask = 'circle'")

cmap = colorstamps.stamps.get_var_J(J = (95,1), mask = 'circle')
axes[0,3].imshow(cmap, origin = 'lower')
axes[0,3].set_title("J = (95,1), mask = 'circle'")

cmap = colorstamps.stamps.get_var_J(J = (50,128))
axes[1,0].imshow(cmap, origin = 'lower')
axes[1,0].set_title('J = (50,128)')

cmap = colorstamps.stamps.get_var_J(J = (50,128), limit_sat = 'shared')
axes[1,1].imshow(cmap, origin = 'lower')
axes[1,1].set_title("J = (50,128), limit_sat = 'shared'")

cmap = colorstamps.stamps.get_var_J(J = (50,128), mask = 'circle')
axes[1,2].imshow(cmap, origin = 'lower')
axes[1,2].set_title("J = (50,128), mask = 'circle'")

cmap = colorstamps.stamps.get_var_J(J = (1,128), mask = 'circle', limit_sat = 'shared')
axes[1,3].imshow(cmap, origin = 'lower')
axes[1,3].set_title("J = (1,128), mask = 'circle',\n limit_sat = 'shared'")

for ax in axes.ravel():
        ax.set_xticks([])
        ax.set_yticks([])
fig.patch.set_facecolor('white')
four_edges
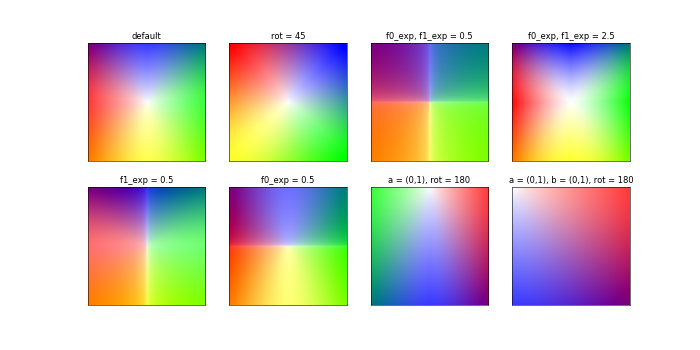
colorstamps.stamps.four_edges() is used for the ‘fourEdges’ and ‘fourCorners’ colormaps
- colorstamps.stamps.four_edges(a=(- 1, 1), b=(- 1, 1), r_exp=- 0.5, f0_exp=1.7, f1_exp=1.7, yellow_exp=0.75, l=256, rot=0)
Generates a 2d colormap with four colors (r,g,b,y) on the edges (or corners if rot = 45) based on the sRGB colorspace, with exponentials
- Parameters
a – limits the range of the y,x plane to use for the colormap. Both default to (-1,1), changing this will zoom in/out on different parts of the colormap
b – limits the range of the y,x plane to use for the colormap. Both default to (-1,1), changing this will zoom in/out on different parts of the colormap
r_exp – float, radial exponent to the lighness, defaults -0.5. Increasing this makes a big white spot in the middle
f0_exp – floats, exponent for the color along the a and b axes, both default 1.7
f1_exp – floats, exponent for the color along the a and b axes, both default 1.7
yellow_exp – additioal exponent for yellow, defaults 0.75
l – size of the colormap, defaults to 256
rot – rotation of the colormap, in degrees
- Returns
a (l,l,3) numpy array of rgb values
import matplotlib.pyplot as plt
import colorstamps
fig, axes = plt.subplots(2,4,figsize=(14,7), dpi = 50)

cmap = colorstamps.stamps.four_edges()
axes[0,0].imshow(cmap, origin = 'lower')
axes[0,0].set_title('default')

cmap = colorstamps.stamps.four_edges(rot = 45)
axes[0,1].imshow(cmap, origin = 'lower')
axes[0,1].set_title('rot = 45')

cmap = colorstamps.stamps.four_edges(f0_exp = 0.5, f1_exp = 0.5)
axes[0,2].imshow(cmap, origin = 'lower')
axes[0,2].set_title('f0_exp, f1_exp = 0.5')

cmap = colorstamps.stamps.four_edges(f0_exp = 2.5, f1_exp = 2.5)
axes[0,3].imshow(cmap, origin = 'lower')
axes[0,3].set_title('f0_exp, f1_exp = 2.5')

cmap = colorstamps.stamps.four_edges(f0_exp = 2.5)
axes[1,3].imshow(cmap, origin = 'lower')
axes[1,3].set_title('f0_exp = 3')

cmap = colorstamps.stamps.four_edges(f1_exp = 0.5)
axes[1,0].imshow(cmap, origin = 'lower')
axes[1,0].set_title('f1_exp = 0.5')

cmap = colorstamps.stamps.four_edges(f0_exp = 0.5)
axes[1,1].imshow(cmap, origin = 'lower')
axes[1,1].set_title('f0_exp = 0.5')

cmap = colorstamps.stamps.four_edges(a = (-1,0), rot = 180)
axes[1,2].imshow(cmap, origin = 'lower')
axes[1,2].set_title('a = (0,1), rot = 180')

cmap = colorstamps.stamps.four_edges(a = (-1,0), b = (0,1), rot = 180)
axes[1,3].imshow(cmap, origin = 'lower')
axes[1,3].set_title('a = (0,1), b = (0,1), rot = 180')

for ax in axes.ravel():
        ax.set_xticks([])
        ax.set_yticks([])
fig.patch.set_facecolor('white')
barrel
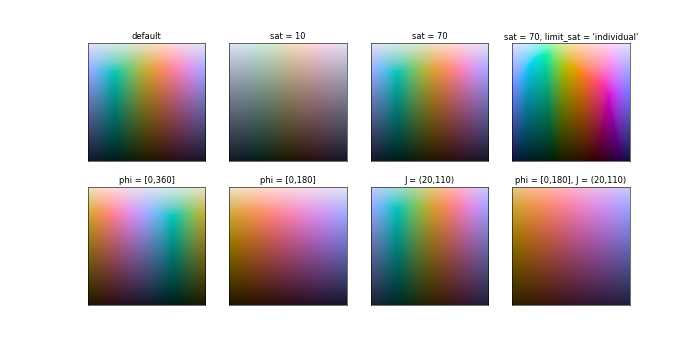
colorstamps.stamps.barrel() is used for the ‘barrel’ colormap
- colorstamps.stamps.barrel(sat=33, phi=[- 180, 180], J=[15, 120], l=256, limit_sat='shared')
Generates a 2d colormap that cycles different hues on the x-axis and has lighness on the y-axis
- Parameters
sat – float, default 33. Desired saturation
phi – range for the hues on the x-axis in degrees, array like of length 2, default [-180,180]
J – limits to lighness on the y-axis, array like of length 2, default [15,120]
l – desired size (l,l,3) of the colormap
limit_sat – string, how to limit the saturation to say within the limits of the RGB colorspace ‘shared’: all hues share same limits ‘individual’: different hues have different limits
- Returns
a (l,l,3) numpy array of rgb values
import matplotlib.pyplot as plt
import colorstamps
fig, axes = plt.subplots(2,4,figsize=(14,7), dpi = 50)

cmap = colorstamps.stamps.barrel()
axes[0,0].imshow(cmap, origin = 'lower')
axes[0,0].set_title('default')

cmap = colorstamps.stamps.barrel(sat = 10)
axes[0,1].imshow(cmap, origin = 'lower')
axes[0,1].set_title('sat = 10')

cmap = colorstamps.stamps.barrel(sat = 70)
axes[0,2].imshow(cmap, origin = 'lower')
axes[0,2].set_title('sat = 70')

cmap = colorstamps.stamps.barrel(sat = 70, limit_sat = 'individual')
axes[0,3].imshow(cmap, origin = 'lower')
axes[0,3].set_title("sat = 70, limit_sat = 'individual'")

cmap = colorstamps.stamps.barrel(phi = [0,360])
axes[1,0].imshow(cmap, origin = 'lower')
axes[1,0].set_title("phi = [0,360]")

cmap = colorstamps.stamps.barrel(phi = [0,180])
axes[1,1].imshow(cmap, origin = 'lower')
axes[1,1].set_title("phi = [0,180]")


cmap = colorstamps.stamps.barrel(J = (20,110))
axes[1,2].imshow(cmap, origin = 'lower')
axes[1,2].set_title("J = (20,110)")

cmap = colorstamps.stamps.barrel(phi = [0,180], J = (20,110))
axes[1,3].imshow(cmap, origin = 'lower')
axes[1,3].set_title("phi = [0,180], J = (20,110)")

for ax in axes.ravel():
        ax.set_xticks([])
        ax.set_yticks([])
fig.patch.set_facecolor('white')
cut
colorstamps.stamps.cut() is used for the ‘cut’, ‘blues’, ‘reds’, ‘greens’, and ‘yellows’ colormaps
- colorstamps.stamps.cut(a=(- 1, 1), sat=33, rot=0, J=[15, 120], l=256, limit_sat='shared')
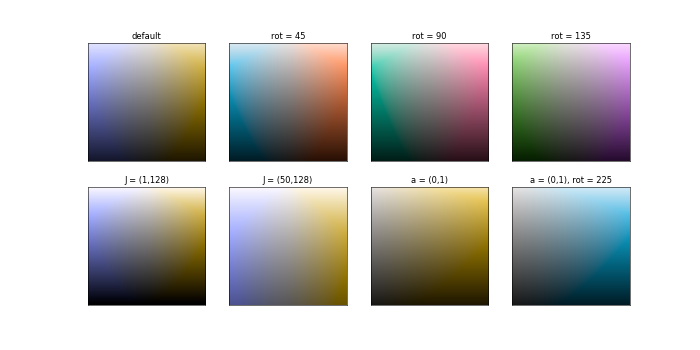
Generates a 2d colormap that is bilinear with saturation along the x-axis and lighness on the y-axis effectivly the cross-section of the Jab colorspace at some angle rot
- Parameters
sat – float, default 33. Desired saturation
rot – the hue, or rotation in the a-b plane to make the cut
J – limits to lighness on the y-axis, array like of length 2, default [15,120]
l – desired size (l,l,3) of the colormap
limit_sat – string, how to limit the saturation to say within the limits of the RGB colorspace ‘shared’: all hues share same limits ‘individual’: different hues have different limits
- Returns
a (l,l,3) numpy array of rgb values
import matplotlib.pyplot as plt
import colorstamps
fig, axes = plt.subplots(2,4,figsize=(14,7), dpi = 50)

cmap = colorstamps.stamps.cut()
axes[0,0].imshow(cmap, origin = 'lower')
axes[0,0].set_title("default")

cmap = colorstamps.stamps.cut(rot = 45)
axes[0,1].imshow(cmap, origin = 'lower')
axes[0,1].set_title("rot = 45")

cmap = colorstamps.stamps.cut(rot = 90)
axes[0,2].imshow(cmap, origin = 'lower')
axes[0,2].set_title("rot = 90")

cmap = colorstamps.stamps.cut(rot = 135)
axes[0,3].imshow(cmap, origin = 'lower')
axes[0,3].set_title("rot = 135")

cmap = colorstamps.stamps.cut(J = (1,128))
axes[1,0].imshow(cmap, origin = 'lower')
axes[1,0].set_title("J = (1,128)")

cmap = colorstamps.stamps.cut(J = (50,128))
axes[1,1].imshow(cmap, origin = 'lower')
axes[1,1].set_title("J = (50,128)")

cmap = colorstamps.stamps.cut(a = (0,1))
axes[1,2].imshow(cmap, origin = 'lower')
axes[1,2].set_title("a = (0,1)")

cmap = colorstamps.stamps.cut(a = (0,1), rot = 225)
axes[1,3].imshow(cmap, origin = 'lower')
axes[1,3].set_title("a = (0,1), rot = 225")

for ax in axes.ravel():
        ax.set_xticks([])
        ax.set_yticks([])
fig.patch.set_facecolor('white')
teuling
colorstamps.stamps.teuling() is here shown with the parameters that generate the named colormaps
- colorstamps.stamps.teuling(l=256, a=0.32, order=[1, 0, 2], white_center=False, green_multiplier=1.0)
Generates a 2d colormap based on:
Teuling, A. J., R. Stöckli, and Sonia I. Seneviratne. “Bivariate colour maps for visualizing climate data.” International journal of climatology 31.9 (2011): 1408-1412.
- Parameters
l – size of the colormap, defaults to 256
a – float between 0 and 1, determines how the second and third color scales along the x and y axis
order – The order in which colors are applied. Should be an array of lenght three with the values 0, 1 and 2, corresponding to red, green and blue. The color at the first index scales equally (0.5) in both x and y, the two others scale according to a and (1-a) along x and y, and y and x
white_center – bool, default False. If true, the center will be colored white
green_multiplier – float, default 1.0. The green part component of the colormap multipled by this value. Can help reduce the luminocity of the green corner to produec a more homogeneous-looking map
- Returns
a (l,l,3) numpy array of rgb values
import matplotlib.pyplot as plt
import colorstamps
import numpy as np

fig, axes = plt.subplots(2,4, figsize = (12,7), dpi = 75)

cmap = colorstamps.stamps.teuling(a = 0.32, order = [0,1,2])
axes[0,0].imshow(cmap, origin = 'lower')
axes[0,0].set_title('a = 0.32, order = [0,1,2]')
cmap = colorstamps.stamps.teuling(a = 0.72, order = [1,0,2])
axes[0,1].imshow(cmap, origin = 'lower')
axes[0,1].set_title('a = 0.72, order = [1,0,2]')
cmap = colorstamps.stamps.teuling(a = 0.32, order = [1,0,2])
axes[0,2].imshow(cmap, origin = 'lower')
axes[0,2].set_title('a = 0.32, order = [1,0,2]')
cmap = colorstamps.stamps.teuling(a = 0.32, order = [1,0,2], green_multiplier = 0.75)
axes[0,3].imshow(cmap, origin = 'lower')
axes[0,3].set_title('a = 0.32, order = [1,0,2],\ngreen_multiplier = 0.75')

cmap = colorstamps.stamps.teuling(a = 0.32, order = [0,1,2], white_center = True)
axes[1,0].imshow(cmap, origin = 'lower')
axes[1,0].set_title('a = 0.32, order = [0,1,2],\nwhite_center = True')
cmap = colorstamps.stamps.teuling(a = 0.72, order = [1,0,2], white_center = True)
axes[1,1].imshow(cmap, origin = 'lower')
axes[1,1].set_title('a = 0.72, order = [1,0,2],\nwhite_center = True')
cmap = colorstamps.stamps.teuling(a = 0.32, order = [1,0,2], )
axes[1,2].imshow(cmap, origin = 'lower')
axes[1,2].set_title('a = 0.32, order = [1,0,2],\nwhite_center = True')
cmap = colorstamps.stamps.teuling(a = 0.32, order = [1,0,2], green_multiplier = 0.75, white_center = True)
axes[1,3].imshow(cmap, origin = 'lower')
axes[1,3].set_title('a = 0.32, order = [1,0,2],\ngreen_multiplier = 0.75,\nwhite_center = True')

for ax in axes.ravel():
    ax.set_xticks([])
    ax.set_yticks([])

fig.patch.set_facecolor('white')

bilinear
colorstamps.stamps.bilinear() is used for genreating bilinear colormaps in the rgb colorspace
- colorstamps.stamps.bilinear(l=256, c0=[1, 0.5, 0], c1=[0, 0.5, 1])
Returns an l by l colormap that interpolates linearly between 4 colors; black, c0, c1 and c0+c1.
- Parameters
l – size of the colormap, defaults to 256
c0 – [r,g,b] array-like defining the color at the top left corner, defaults to [1,0.5,0] (orange)
c1 – [r,g,b] array-like defining the color at the bottom right corner, defaults to [0,0.5,1]] (light blue)
- Returns
a (l,l,3) numpy array of rgb values
fig, axes = plt.subplots(1,4, figsize = (12,7), dpi = 75)

cmap = colorstamps.stamps.bilinear(c0 = [1,0.5,0], c1 = [0,0.5,1])
axes[0].imshow(cmap, origin = 'lower')
axes[0].set_title('c0 = [1,0.5,0], c1 = [0,0.5,1]')
cmap = colorstamps.stamps.bilinear(c0 = [0.5,1,0], c1 = [0.5,0,1])
axes[1].imshow(cmap, origin = 'lower')
axes[1].set_title('c0 = [0.5,1,0], c1 = [0.5,0,1]')
cmap = colorstamps.stamps.bilinear(c0 = [0,1,0], c1 = [0,0,1])
axes[2].imshow(cmap, origin = 'lower')
axes[2].set_title('c0 = [0,1,0], c1 = [0,0,1]')
cmap = colorstamps.stamps.bilinear(c0 = [1,0,0], c1 = [0,0,1])
axes[3].imshow(cmap, origin = 'lower')
axes[3].set_title('c0 = [1,0,0], c1 = [0,0,1]')

for ax in axes.ravel():
    ax.set_xticks([])
    ax.set_yticks([])
fig.patch.set_facecolor('white')

get_2dcmap_from_mpl
colorstamps.stamps.get_2dcmap_from_mpl() is used for genreating 2d colormaps from 1d matplotlib colormaps
- colorstamps.stamps.get_2dcmap_from_mpl(string, J=[15, 120], l=256, limit_sat='shared')
Generates a 2d colormap from a 1d colormap found in matplotlib
- Parameters
string – name of the matplotlib colormap
J – limits to lighness on the y-axis, array like of length 2, default [15,120]
l – desired size (l,l,3) of the colormap
limit_sat – string, how to limit the saturation to say within the limits of the RGB colorspace ‘shared’: all hues share same limits ‘individual’: different hues have different limits
- Returns
a (l,l,3) numpy array of rgb values
import matplotlib.pyplot as plt
import colorstamps
import numpy as np

n = int(np.sqrt(len(colorstamps.stamps.mpl_cmaps)))+1
fig, axes = plt.subplots(n,n, figsize = (20,24))
axes = axes.ravel()

for i, name in enumerate(colorstamps.stamps.mpl_cmaps):
    cmap = colorstamps.stamps.get_2dcmap_from_mpl(name, l = 64, limit_sat = 'individual')
    axes[i].imshow(cmap, origin = 'lower')
    axes[i].set_title(name)
    axes[i].invert_yaxis()

for ax in axes:
    ax.set_xticks([])
    ax.set_yticks([])

fig.patch.set_facecolor('white')

Helper functions for generating colormaps
- colorstamps.stamps.mask_rgb(rgb, a, b, mask)
function that masks an rgb colormap with np.nan according to the string mask
- Parameters
rgb – (l,l,3) matrix
a – values of a and b. if mask = ‘circle’ anyting with sqrt(a**2+b**2)>1 will be np.nan
b – values of a and b. if mask = ‘circle’ anyting with sqrt(a**2+b**2)>1 will be np.nan
mask – string: ‘circle’ -> masks everything outside a circle defined as where sqrt(a**2+b**2)>1 ‘no-mask’ -> do nothing ‘unavailable’-> masks invalid rgb values (i.e. <0 or >1)
- colorstamps.stamps.set_ab_rot(Jab, ar, br, rot)
sets the [:,:,1] and [:,:,2] axes of a Jab colormap to ar and br then rotates the ab color plane according to the angle rot
- Parameters
Jab – (l,l,3) colormap
ar – 1d array, typically made by np.linspace()
br – 1d array, typically made by np.linspace()
rot – angle in degrees
- Returns
None (but Jab changed in-place)
- colorstamps.stamps.parse_name_postfix(cmap, a, b)
if a cmap name has a postfix that details the quadrant/side, this will translate that to ranges in a and/or b. example: parse_name_postfix(‘cone tr’, a, b) return a and b so that they span the top right quadrant inputs a and b so that both can be returned even if only one is changed
- Parameters
cmap – string, potentially with a postfix detailing quadrant/side following a space, i.e. ‘cone tr’. The postfix translates: ‘b’ -> bottom, ‘t’ -> top, ‘l’ -> left, ‘r’ -> right. Any combination (b,t)+(l,r) is possible to select quadrants
a – current limits for a, not checked but should be a tuple of length 2
b – current limits for b, not checked but should be a tuple of length 2
- Returns
cmap (stripped of the postfix) a, tuple of length 2 b, tuple of length 2
- Return type
tuple (cmap, a, b)
- colorstamps.stamps.get_sat_limts()
returns the a 2d matrix of approximate limits to sat (radius in a-b space) in terms of phi and J
- colorstamps.stamps.apply_sat_limit(Jab, limit_sat='shared')
apply a saturation limit to Jab in order to ensure valid saturation when the limit of the RGB colorspace is reached
- Parameters
Jab – np array of shape (n,m,3) encoded in the colorspace
limit_sat – ‘shared’ or ‘individual’ if ‘shared’, all hues share same limit to saturation (the minimum where all saturation values present in the colormap can be represented) if ‘individual’, different hues have different sauration limits
- Returns
None (Jab is modified in-place)
- colorstamps.stamps.apply_radial_sat_limit(Jab, limit_sat='shared')
apply a radial saturation limit to Jab in order to make the saturation radial when the limit of the RGB colorspace is reached the behaviour if limit_sat == ‘shared’ is different from apply_sat_limit() in this function all possible hues are always included, but for apply_sat_limit() only present hues are considered
- Parameters
Jab – np array of shape (n,m,3) encoded in the colorspace
limit_sat – ‘shared’ or ‘individual’ if ‘shared’, all hues share same limit to saturation (the minimum where all are present) if ‘individual’, different hues have different sauration limits
- Returns
None (Jab is modified in-place)