colorstamps.helpers module
Apply colormap to data
- colorstamps.helpers.apply_stamp(data_0, data_1, cmap, vmin=None, vmax=None, vmin_0=None, vmax_0=None, vmin_1=None, vmax_1=None, clip=None, l=None, rot=None, J=None, sat=None, limit_sat=None, a=None, b=None)
Applies a cmap to data_0 and data_1 which formas axis 0 and 1 on the cmap if vmin/vmax is not specified the limits are set by set to np.min() and np.max() for data_0 and data_1
- Parameters
data_0 – np array of shape(n,m) to apply to cmap axis 0
data_1 – np array of shape(n,m) to apply to cmap axis 1
cmap – np array of shapek (k,k,3) with rgb values or a string descrbing a named colormap
vmin[max] – optional float, lower[upper] bound for both data_0 and data_1
vmin[max]_0[1] – optional float, lower[upper] bound for data_0[1], overrides vmin[max]
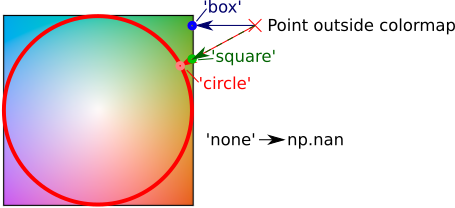
clip – (string), ‘circle’ clips the data to fit a circular colormap using radial projection, ‘square’, clips the data to fit a square colormap using radial projection ‘box’, clips the data to fit a square colormap using by limiting the first and second axis independently ‘none’ data out of bounds will have r,g,b = np.nan default behaviour is ‘circle’ or ‘square’ square if a radial-type cmap is called by name, otherwise ‘box’
l – arguments passed to stamps.get_cmap() when a colormap is called by name, see stamps.get_cmap() for explanation
rot – arguments passed to stamps.get_cmap() when a colormap is called by name, see stamps.get_cmap() for explanation
J – arguments passed to stamps.get_cmap() when a colormap is called by name, see stamps.get_cmap() for explanation
sat – arguments passed to stamps.get_cmap() when a colormap is called by name, see stamps.get_cmap() for explanation
limit_sat – arguments passed to stamps.get_cmap() when a colormap is called by name, see stamps.get_cmap() for explanation
a – arguments passed to stamps.get_cmap() when a colormap is called by name, see stamps.get_cmap() for explanation
b (a and) – arguments passed to stamps.get_cmap() when a colormap is called by name, see stamps.get_cmap() for explanation
b – if clip = ‘circle’ these also modify the clip
- Returns
tuple (rgb, stamp) where rgb is a numpy array of (n,m,3) with values 0 -> 1 defining sRGB color in image and stamp is a colorstamps.helpers.Stamp object.
Example:
import numpy as np
import matplotlib.pyplot as plt
import colorstamps
# img = (100,200,2) example data
img = colorstamps.helpers.get_random_data()
# map data to colormap
fig, axes = plt.subplots(1,2,figsize=(10,3), dpi = 100)

'''
inputing cmap to colorstamps.apply_stamp() by name
'''
rgb, stamp = colorstamps.apply_stamp(img[:,:,0], img[:,:,1],
                                   'cut', rot = 45,
                                   vmin_0 = -1.2, vmax_0 = 1.2,
                                   vmin_1 = -1, vmax_1 = 1,
                                 )

axes[0].imshow(rgb)
overlaid_ax = stamp.overlay_ax(axes[0],
                lower_left_corner = [0.7,0.85], width = 0.2)

'''
getting cmap firts (as a numpy array)
and rotating the cmap 90 degrees
Then sending to colorstamps.apply_stamp()
'''
cmap_as_array = colorstamps.stamps.get_cmap('cut', rot = 45)
cmap_as_array = np.rot90(cmap_as_array)
rgb, stamp = colorstamps.apply_stamp(img[:,:,0], img[:,:,1],
                                   cmap_as_array,
                                   vmin_0 = -1.2, vmax_0 = 1.2,
                                   vmin_1 = -1, vmax_1 = 1,
                                 )
axes[1].imshow(rgb)
overlaid_ax = stamp.overlay_ax(axes[1],
                lower_left_corner = [0.7,0.85], width = 0.2)

If a circular colormap is passed as an array, you must also set clip = ‘circle’. Here we show both without and with the clip = ‘circle’ option:
fig, axes = plt.subplots(1,2,figsize=(10,3), dpi = 100)
cmap_as_array = colorstamps.stamps.get_cmap('cone')

rgb, stamp = colorstamps.apply_stamp(img[:,:,0], img[:,:,1],
                cmap_as_array)
axes[0].imshow(rgb)
overlaid_ax = stamp.overlay_ax(axes[0],
                lower_left_corner = [0.7,0.85], width = 0.2)

rgb, stamp = colorstamps.apply_stamp(img[:,:,0], img[:,:,1],
                cmap_as_array, clip = 'circle')
axes[1].imshow(rgb)
overlaid_ax = stamp.overlay_ax(axes[1],
                lower_left_corner = [0.7,0.85], width = 0.2)

The ‘clip’ options determines the behaviour when a point outside the colormap is requested. The following image shows the different options.
The Stamp class
- class colorstamps.Stamp(cmap, l=None, rot=None, J=None, sat=None, limit_sat=None, a=None, b=None)
Class for holding 2d colormaps
In normal use class objects of this class will be generated by apply_stamp(), and not generated. May be called directly to inspect colormaps using the member funciton Stamp.eval() without having any data, as needed for apply_stamp(). Member variables self.vmin_0, self.vmin_1, self.vmax_0, self.vmax_1 are set when invoked by apply_stamp() and determine the limts.
- Parameters
cmap – numpy array of shape (l,l,3) with rgb values or string for a valid colormap available with stamps.get_cmap()
l – passed to stamps.get_cmap() if cmap is a string, otherwise ignored
rot – passed to stamps.get_cmap() if cmap is a string, otherwise ignored
J – passed to stamps.get_cmap() if cmap is a string, otherwise ignored
sat – passed to stamps.get_cmap() if cmap is a string, otherwise ignored
limit_sat – passed to stamps.get_cmap() if cmap is a string, otherwise ignored
a – passed to stamps.get_cmap() if cmap is a string, otherwise ignored
b – passed to stamps.get_cmap() if cmap is a string, otherwise ignored
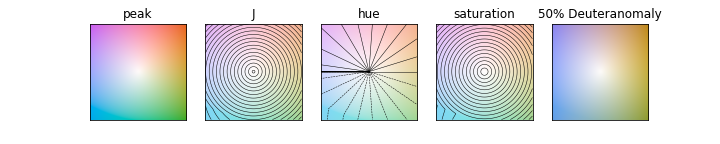
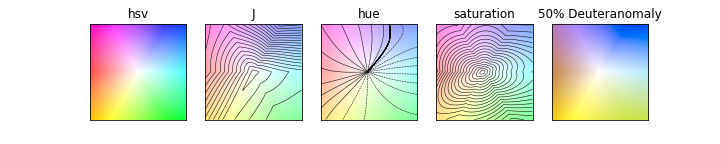
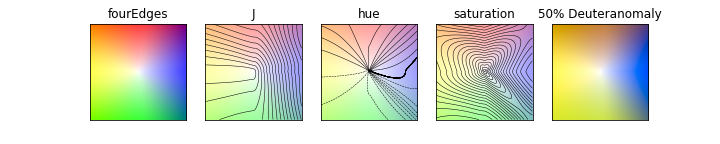
- eval(axes=None)
plots the colormap overlaid with contour plots of J, hue and sat and simulated partial colorblindness (partial deuteranomaly appears to be the most common kind https://en.wikipedia.org/wiki/Color_blindness)
- Parameters
axes – default None, alternatively a list of 5 matplotlib axes if None, a fig with 5 axes will be created
- Returns
fig, axes if axes are not declared as input, otherwise None
- overlay_ax(ax, lower_left_corner=[0.66, 0.66], width=None, height=0.25)
overlays new axes over the existing axes (‘ax’) with the colormap
- Parameters
ax – axes to position new axes over
lower_left_corner – [y,x] coordinates in fraction coorniates of ax descrbing position of new ax
width – float (optional), width of new axes
heght – float (optional) height of the new axes (if width not specified)
- Returns
cmap_ax, matplotlib axes object with the colormap
- show_in_ax(cmap_ax)
plots the colormap as an image in ax with correct limits
- Parameters
cmap_ax – matplotlib axes object
- Returns
None
Example use of colorstamps.Stamp.eval()
import colorstamps

stamp = colorstamps.Stamp('peak')
fig, ax = stamp.eval()
stamp = colorstamps.Stamp('hsv')
fig, ax = stamp.eval()
stamp = colorstamps.Stamp('fourEdges')
fig, ax = stamp.eval()